
Locally Sales were Up
Across the U.S.:
At the end of August there stood an 8.5 month supply of existing homes for sale across the U.S., down from the 9.3 month supply in July. This improvement occurred despite homes sales easing during the month.
Sales of existing U.S. homes dropped in August 2.7% to a seasonally adjusted annual rate of 5.10 million units. The pace of sales in July was 5.24 million. Analysts had expected August to return closer to 5.4 million units.
The drop in inventory is a good sign that the market is still moving back toward more sustainable levels. A balanced market will be reached when inventories return to a six month supply.
The inventory of unsold homes is 16.4% lower than year ago levels, due mainly to four consecutive months of sales gains from April through July. During that time, sales had jumped 15.2 percent.
Besides the increase in sales, builders have taken a more measured approach to bringing new homes on the market. New construction inventories, 262,000 units at the end of August, are at their lowest levels since 1992. This is also a factor in moving toward better balance in the marketplace.
Thurston County:
Locally, home inventory reached a 6.7 month supply at the end of August. While this still represents a Buyer’s market, it is improved from July where a 7.4 month supply existed. The August number represents the lowest level since September 2008. The big improvement was due to the jump in August home sales, which were up 12.2% from a year ago.
While the overall market is trending in the right direction, some segments within the market are still struggling. For example, the $800,000 and above price range had a 52.6 month supply of homes. This means that if no additional homes came on the market it would take nearly four and a half years to sell all the homes at the current pace of sales.
Sales in that upper price range are off 81% from a year ago. There have been only 4 MLS sales in this price range year to date. During the same period last year there were 21 sales.
Most of the positive movement in the market remains at the lower price ranges. The under $200,000 price range has only a 5.5 month supply of homes, making it a balanced market. Not surprisingly, sales in this price range year to date are up 38% compared to the same period in 2008.
In other price ranges, sales are off 19% in the $200,000-$299,999 range, off 16% in the $300,000-$399,999 range, off 33% in the $400,000-$499,999 range, and off 47% in the $500,000-$599,999 range.
Statistics compiled by Coldwell Banker Evergreen Olympic Realty, Inc. from the NWMLS database. Statistics not compiled or published by NWMLS.
Friday, September 25, 2009
Monday, September 21, 2009
Perspective on Positive Housing Numbers
Housing sales across the country are on the rise. Locally, Thurston County sales were up 12.2% in August 2009 over August 2008. That is surely good news, but sales are on the rise from very low numbers last year.
Sales in August 2008 were the lowest level that month had seen since 2000. So the big percentage uptick this August puts us back to August 2001 levels.
No one is saying that the increase in sales is not welcomed, but we are a long way from a “normal” year in sales.
Prior to the recent boom market, the number of sales grew by an average of 5.9% per year. Applying that rate of growth to our market from 2002 (the year before the boom started) onward, we’d expect to have 4,334 sales by year end. Instead, our market is on pace to have 2,544 sales. That seems like quite a big gap.
However, during the boom years, sales far exceeded the number historically seen. Since 2001, we have 32,053 sales. The numbers of sales we’d project for that time would have been just 31,356. (See Chart 1 below).

Click image to enlarge.
So even with a huge drop off in sales the last two years, our market is still pacing longer-term projections. What’s the old saying, biting off more than can be chewed? The numbers mean that our market is finally absorbing the excess sales bitten off during the peak.
What this means going forward is that we are returning to more sustainable times in our market. While it is too optimistic to think we’ll get back to our trend line for sales next year, nearly 4,600 sales, we should see more sales as demand is now becoming pent up.
However, demand will not be robust enough to overcome still overpriced properties. Prices, while off 12.8% from the peak, are still above our historic trend line (See Chart 2 below).

Click image to enlarge.
As we’ve reported before, expect average prices to continue to come down (see our September 10, 2009 post). As they do, we will see more buyers enter the market.
In fact, buyers are active today, jumping quickly on well priced homes. According to our latest market study, homes that did not require a price reduction before receiving an offer are going under contract in just 27 days. That is 18 days faster than the peak of our seller’s market.
Price is still the key to our market’s normalization. Read this interesting article for some additional perspective: http://www.cnbc.com/id/32420604/.
Statistics compiled by Coldwell Banker Evergreen Olympic Realty, Inc. from the NWMLS database. Statistics not compiled or published by NWMLS.
Thursday, September 10, 2009
Washington vs. the U.S., Why Our Area’s News May Not Match the Rest of the Nation’s
Positive news in the housing market is now consistently reported around the country. Sales are increasing, prices are inching up in some places and drops in values are easing in other areas.
In our blog we have even been reporting our area’s share of positive news. After a couple of years of consistently tough news, these positive signs are certainly welcomed. However, our local market overall is still in a correction mode – and we expect to trail the rest of the nation in the housing recovery. The reason is that our market was late to begin its correction.
While much of the rest of the country, including the hardest hit states, started to correct in late 2005 and early 2006, our market remained strong until the summer of 2007.
Several factors helped our market delay the correction – a strong job base and low unemployment, significant inbound migration to the state, and a lot less overbuilding than occurred in places like California, Nevada, Arizona, and Florida. In addition, our region’s property values did not jump as high as these other states. For example, from 2000 through 2006, California’s median home price jumped an astounding 124.5%. Washington’s median price increased 72.5% during the same period (Source: www.FHFA.gov).
While our price increases were nowhere near California’s, the appreciation was still far above our historical levels of growth. We would have expected just 41% average price appreciation from 2000 through 2006, based on our local area’s historic price appreciation prior to the 2003-2006 seller’s market (5.9% per year).
Ultimately, our level of price appreciation proved too much, pushing well above the level of sustainable demand. This triggered our market’s correction in the second half of 2007, a full 18 months after most of the rest of the nation.
Given that our market did not fly as close to the sun as places like California, we might not be a full 18 months behind that state when it comes to marking our bottom. However, we are certainly going to lag behind.
Chart 1 below shows the price history of a $200,000 home purchased in the year 2000. California’s trajectory is much more extreme than Washington’s. California prices have now corrected below its historic trend line of price appreciation. This significant drop reflects the serious oversupply of homes that persisted there over the past several years.

Click image to enlarge.
Now that prices and supply are down, home sales there are bouncing up. According to the California Association of Realtors, in 2008 California experienced a 26.8% increase in sales of existing homes. There is a 25% increase expected this year. That market is returning to more sustainable times.
For our part, Thurston County remains above its historic trend line for price appreciation despite two years of price declines. Chart 2 shows that our average price is still almost 6% above expected levels.

Click image to enlarge.
Still, more and more sellers are pricing their homes right to reflect today’s reality. We see everyday that even though the market overall is still correcting an individual home may already be at its market bottom. This is reflected in the 12.2% uptick in home sales during August. Buyers are clearly recognizing the value of these well-priced homes and they are acting quickly to buy them. See our July 30, 2009 post.
The key is getting back to relative affordability in all price segments. Many price segments, such as under $250,000, are at levels of affordability not seen in more than five years. Other market segments are still overpriced.
The Federal Housing Finance Agency’s quarterly report ranking 297 U.S. cities for price appreciation shows that we are behind the rest of the nation in price adjustments. The report ranks cities’ price gains over the past 5 years, one year, and latest quarter. Olympia ranks 11th best for price appreciation over the past 5 years. That number is simply unfathomable. We are a great area, but number 11 in the country?
Just nine months ago our ranking was 12th on the list, but don’t take that as a sign that things are improving. Rather it shows how much the rest of the country has fallen. Our 12th place ranking last year was the result of almost 61% price appreciation over the previous 5 years. Our 11th place ranking this year reflects just 39% price appreciation over the past 5 years. So in three quarters we’ve dropped 22% points of price gains.
Earlier this decade, we ranked closer to the bottom of the list, with a ranking in the bottom 15% of the nation. (See Chart 3 below). We should not expect to stay in the top 3% of the country. And, in fact, the change is already happening. Olympia’s ranking for price appreciation over the last year is 213th, and over the last quarter is 237th.

Click image to enlarge.
The data shows that our market’s correction was simply late in starting. We will continue to correct and settle out in more sustainable territory.
So as we continue to hear positive news coming from around the nation, you’ll know that our local market news will continue to lag until next year. Further proof, once again, that all real estate is local.
Statistics compiled by Coldwell Banker Evergreen Olympic Realty, Inc. from the NWMLS database. Statistics not compiled or published by NWMLS.
Wednesday, September 9, 2009
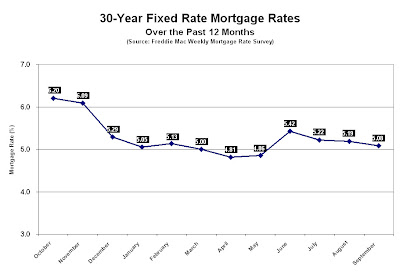
Mortgage Rates Down Again
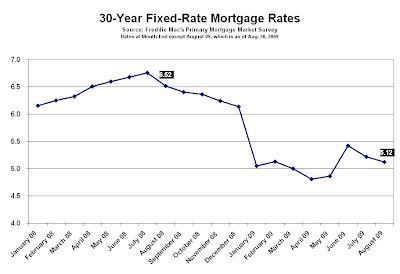
Mortgage rates are at their lowest levels since late May, according to Freddie Mac’s latest Weekly Primary Mortgage Market Survey. For the week ending September 3, 2009, the average rate on a 30-year fixed-rate mortgage was 5.08% with 0.7% fees and points. A year ago, the average rate on the same mortgage was 6.04%.
Mortgage rates are one of the main reasons that housing sales are starting to improve. Combined with lower home prices, these rates have greatly increased affordability. Buyers have responded by moving sales of homes in Thurston County up 12.2% in August 2009 compared to year ago numbers.
Source: http://www.freddiemac.com/pmms/#Historical
Click image to enlarge.
Click image to enlarge.
Mortgage rates are one of the main reasons that housing sales are starting to improve. Combined with lower home prices, these rates have greatly increased affordability. Buyers have responded by moving sales of homes in Thurston County up 12.2% in August 2009 compared to year ago numbers.
Source: http://www.freddiemac.com/pmms/#Historical

Click image to enlarge.

Click image to enlarge.
Friday, September 4, 2009
With Prices Down, August Sales Jump Up
Thurston County August home sales posted the best year over year percentage gain in almost three years. Lower prices pushed the month’s homes sales up 12.2% over year ago figures (332 sales in 2009 vs. 296 sales in 2008).
This is only the fourth month out of the last 32 where a positive gain in sales has been posted. The other three months with sales gains were only slight percentage upticks. We have to look all the way back to December 2006 to find the last 12% gain in sales.
Price reductions have put affordability levels at the highest levels in decades. Add attractive interest rates and an $8,000 first-time buyer tax credit, and we have buyers coming back into the market.
Pending sales, which are an indicator of sales a month or two down the road, were up 5.9% year over year in August. That is a nice gain but off the big 14.7% jump experienced in July.
Our market will need a string of months like August if we are to get back to a truly balanced market. That is because inventory levels still place us squarely in a buyer’s market with just over a seven month supply of homes for sale.
Prices will continue to correct down until we are back in a balanced market, which has a four to six month supply of homes.
Thurston County’s year to date median price has fallen 6.5% from last year. It now stands at $243,000 compared to $259,900 last year.
Even with these price adjustments, the market as a whole is still above its historic trend line for price appreciation (see our July 28, 2009 post for more on prices). We expect prices will continue to moderate through the spring of next year and then start a slow recovery.
The big jump in home sales last month, however, is a clear reminder that each home has its own price bottom. Buyers are gobbling up the well-priced homes. The still overpriced homes are being ignored until prices are reduced (for more on this topic see our August 18, 2009 post).
More and more sellers understand the need to get the price right now. In July, 41% of sellers sold without needing a price reduction. Only 29% of sellers at the start of the year started with the right price. Buyers are starting to learn that if they wait for a “market” bottom they may just miss out on the home of their dreams that is already on its way back up.
Next week: Prices are starting to inch up around the country, why not here. Learn why our market will continue to lag behind the rest of the country as we come out of the housing slump.
Wednesday, September 2, 2009
U.S. Pending Home Sales Reach 2-year High
Pending home sales are at their highest level since June 2007, according to the July Pending Home Sales Index released this week by the National Association of Realtors.
The Index is 3.2% higher than the June reading, and it is 12% higher than July 2008. July was the sixth straight month with an increase in pending sales. In the eight year history of the Index, there has never been such a string of positive up ticks.
As we reported early last month, Thurston County pending sales continue to outperform 2008 levels. In July, pending sales increased 14.7% over July 2008.
For more on our local pending sales, see our August 6, 2009 posting. Later this week, we will have a report on August pending home sales.
Subscribe to:
Posts (Atom)
